We trick ourselves into making connections.
Most people are convinced that the full moon makes other behave strangely even though there is no scientific evidence to support that claim.[1] This belief in the connection between two unrelated things is called an illusory-correlation bias.[2]
We’re all kidding ourselves when we don’t understand the difference between correlation and causation.
Causal analysis can help you determine whether two variables have a relationship base on correlation or causation. Through causal analysis you can identify problems, determine their causes, and develop a plan to correct the situation.[3] When two variables correlate, it means that they have a linear relationship.[4]When you wore your lucky shoes and nailed that job interview, there is a linear relationship between the shoes and the interview. Causation is the extent to which the two variables depend on one another. When the sun beats down on pavement, we know that the pavement will be warm. The sun causes the temperature of the surface to rise. In this case the sun and the heat of the pavement have both a correlative and a causative relationship. Your lucky shoes didn’t cause you to ace your interview, though.
How can we apply causal analysis to our lives?
Wouldn’t it be nice to understand which variables really led to your success instead of giving all your power to your lucky shoes? Identifying root causes not only enables us to prevent problems, but it can help us understand the great things we are already doing. Maybe on the day of your interview, you were confident, prepared, and passionate. Give yourself some credit! To use a practical example, causal analysis could show a restaurant manager that the full moon isn’t what led to the rush of uncooperative customers at dinnertime. During that shift, the most inexperienced employees were scheduled to work together on the busiest night of the week, which happened to coincide with the full moon. The food came out slowly, which frustrated the servers. The customers were unhappy because they had to wait, and their dinner got cold in the process. If the restaurant manager continued to blame the moon, he or she would miss an opportunity to prevent another disastrous night. In the future, the manager might choose to schedule more experienced and faster workers during the busiest nights of the week.
Bust through your illusions with a causal layered analysis iceberg
You can imagine your problem as an iceberg.[5] Perceptions about a problem, known as the litany, are the tip of the iceberg. Your belief that your day is ruined because a black cat crossed your path is part of the litany. Just below the surface, our iceberg supports the litany through social causes. Maybe you connect black cats to the worst day that you ever had. Causal layered analysis doesn’t stop there, though, and our goal is to break apart the illusory-correlation bias between black cats and the quality of your day. Perhaps in your culture, black cats are bad luck. Worldview is the third layer of your iceberg, and it lends support to social beliefs and the litany. The lowest level of the iceberg is comprised of myths and metaphors. These are old beliefs that underpin worldviews. Many people think that black cats are bad luck because of a long-standing association between cats and witchcraft and the historical belief that cats smothered children while they slept [6] When you recognize that you have constructed a false narrative, you can work to overcome it. A black cat may have crossed your path as you received bad news, and since it was such a terrible day, your mind easily associated the cat with something negative. This negative association was reinforced by culture, worldview, and myths. The cat has a correlative relationship to the bad day, but it didn’t cause it.
How can we avoid falling into the illusory-correlation trap?
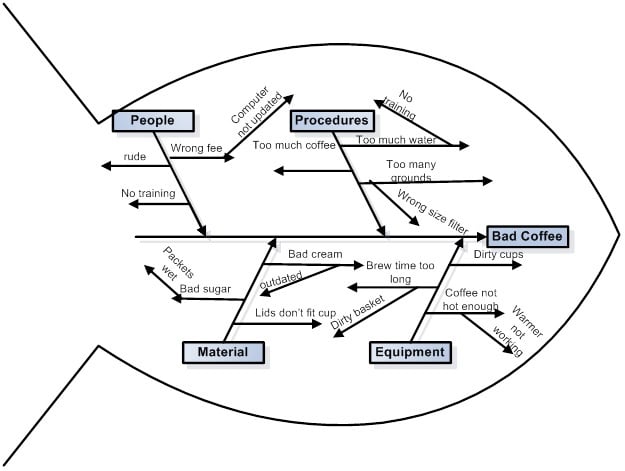
Follow these steps to get to the core of a problem and verify causal relationships:[7] It may also be helpful to use a Fishbone or Ishikawa Diagram to understand cause and effect relationships.[8] The diagram makes it easier to visualize the first three steps of causal analysis.
In the above example, you can see the the problem is bad coffee. The categories that affect coffee quality (procedures, people, equipment, and material) are the ribs of the fish in the diagram. The arrows coming from each category name variables that could contribute to poor outcomes. After you’ve mapped potential causes, it will be up to you and your team to complete the causal analysis by developing, acting on, and evaluating your action plan .
What’s the easiest way to identify causal relationships?
The quickest way to find a solution is to view your problem objectively. When we muddle our vision with cultural baggage and superstition, we lose sight of variables that do have a causal relationship to the issue. If you catch yourself falling victim to illusory-correlation bias, know that you are not alone. Many of us have blamed a red herring at least once in our lives. The trick is to use clear causal analysis so that we can disrupt negative patterns and discover better solutions. Featured photo credit: Stocksnap via stocksnap.io
