Nobody likes to play the waiting game, especially when it comes to job hunting. With the corporate world growing more competitive each day, jobseekers need to be extra creative to get noticed by potential employers. Some invest in an online portfolio [1] to highlight their skills, positive qualities, and experience. Others, on the other hand, focus on spicing up their resumes to make a solid first impression.
Going Visual with Your Resume
Let’s face it, the best employers probably receive mountains of resumes each day. You simply can’t afford to send something that looks generic, plain, and straight up uninspiring. But with an infographic resume, you will—at the very least—intrigue them enough to view your entire application from start to finish. An infographic utilizes visual elements such as charts and graphical lists to make information more digestible for readers. And believe it or not, you don’t need to be a professional designer to create a stunning infographic resume. Here’s how:
1. Start with a Killer Infographic Idea
The best accomplishments always start with a brilliant idea. Before you create your infographic resume, you must first understand the different types of data visualizations [2] and how they work. Charts, for example, is a great way to represent measurable data whereas timelines are useful for understanding the history behind any particular topic. Of course, you’re free to utilize multiple visualizations in your infographic resume. For example, you can kick off with a timeline that highlights your educational background and work experience. Once you’ve grabbed the employer’s attention, follow up with a graphical anatomy that breaks down your skills, strengths, and hobbies. And to seal the deal, create a simple comparison between you and the average employee in your field. Just remember that cluttering too much visualizations in one infographic may confuse prospective employers. To make sure it flows and reads naturally, use a long-scrolling format to show one data visualization at a time. This will also make your infographic more readable in mobile displays. Here’s an example on how to creatively organize visualizations in your infographic resume – featuring Hollywood’s Ashton Kutcher:
Infographic Source [3]
2. Select a Color Scheme
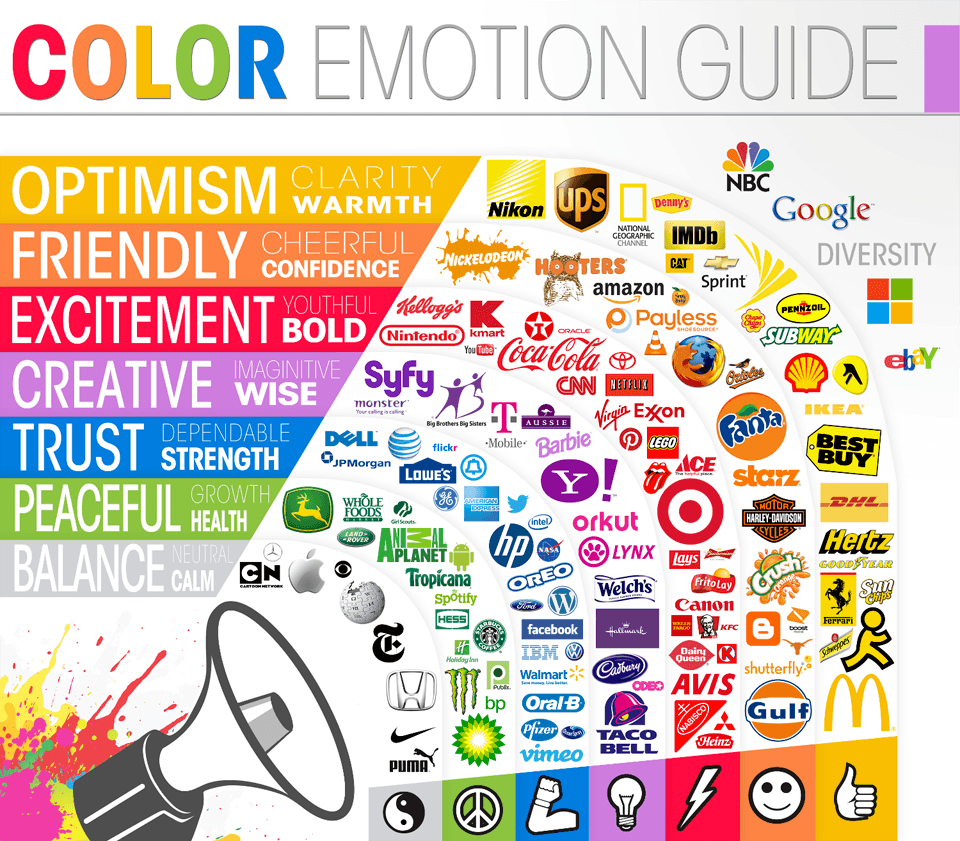
After choosing the data visualization types to represent the information in your resume, the next step is to pick a color scheme to ensure cohesive design. Apart from your creative flair, you also need a bit of psychology to give employers the right impression. Take note that certain colors can inspire different emotions such as trust, warmth, optimism, and relaxation. Although it’s tempting to use your favorite color, remember that your resume isn’t for you – it’s for your potential employers. Below are what popular colors can instill into your personal brand:
Red
• Intense • Passionate • Impulsive
Yellow
• Approachable • Cheerful • Optimistic • Youthful
Blue
• Trustworthy • Productive • Calm • Sincere
Orange
• Enthusiastic • Cautious • Aggressive • Confident
Green
• Relaxed • Financial-savvy • Environmentally aware
Purple
• Success-driven • Imaginative • Creative Below is a simple infographic to put everything in perspective:
Infographic source [4]
3. Get to Know Your Tools
It’s nearly time to give your resume that much-needed makeover. But before you get your hands dirty, you must first get to know the tools you need to use. The obvious choice is Adobe Photoshop [5], which has all the firepower you need to create professional graphics for all purposes. But apart from its price, it also has a steep learning curve. The quickest way to learn Photoshop is to browse for online tutorials [6]and various learning resources. If you want a simpler alternative, however, then Canva [7]can provide you with plenty of built-in resources specifically designed for infographics and resumes. You can get started by heading over to their site and registering for a free account.
Here is a closer look on how Canva works:
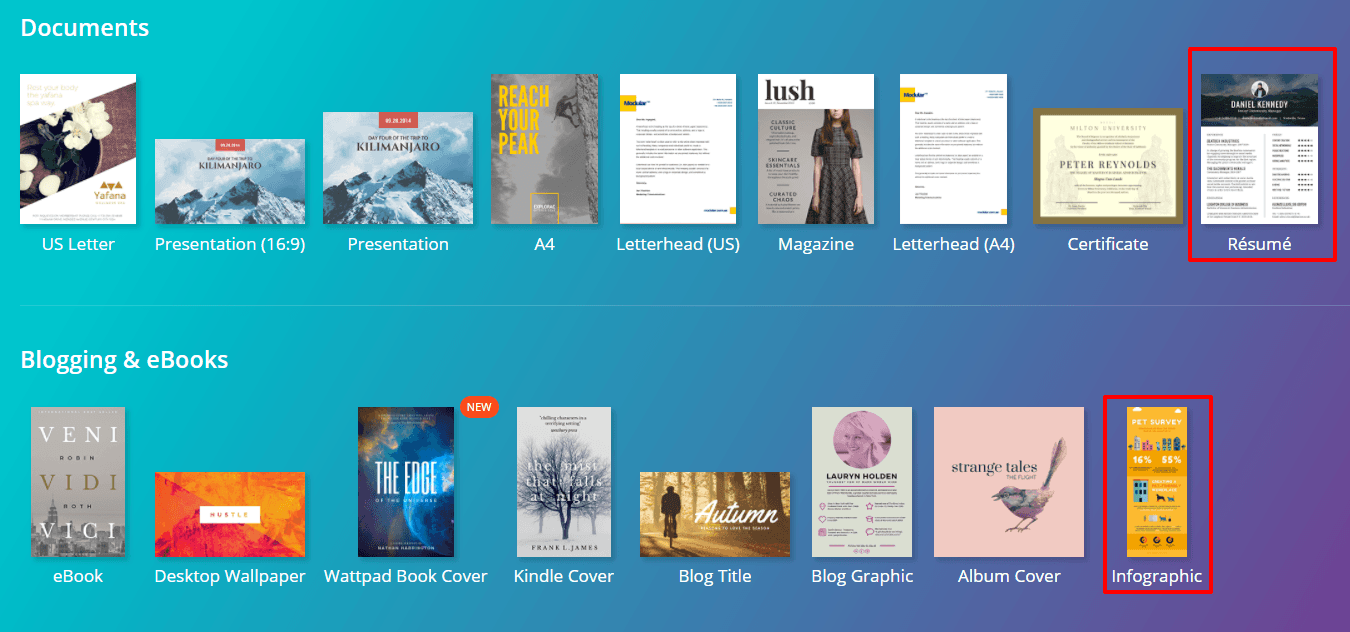
After signing up, click the More button located in the upper right corner of the main dashboard. From there, scroll down and select Resume or Infographic. The resume option is more straightforward, but choosing an infographic template gives you more flexibility.
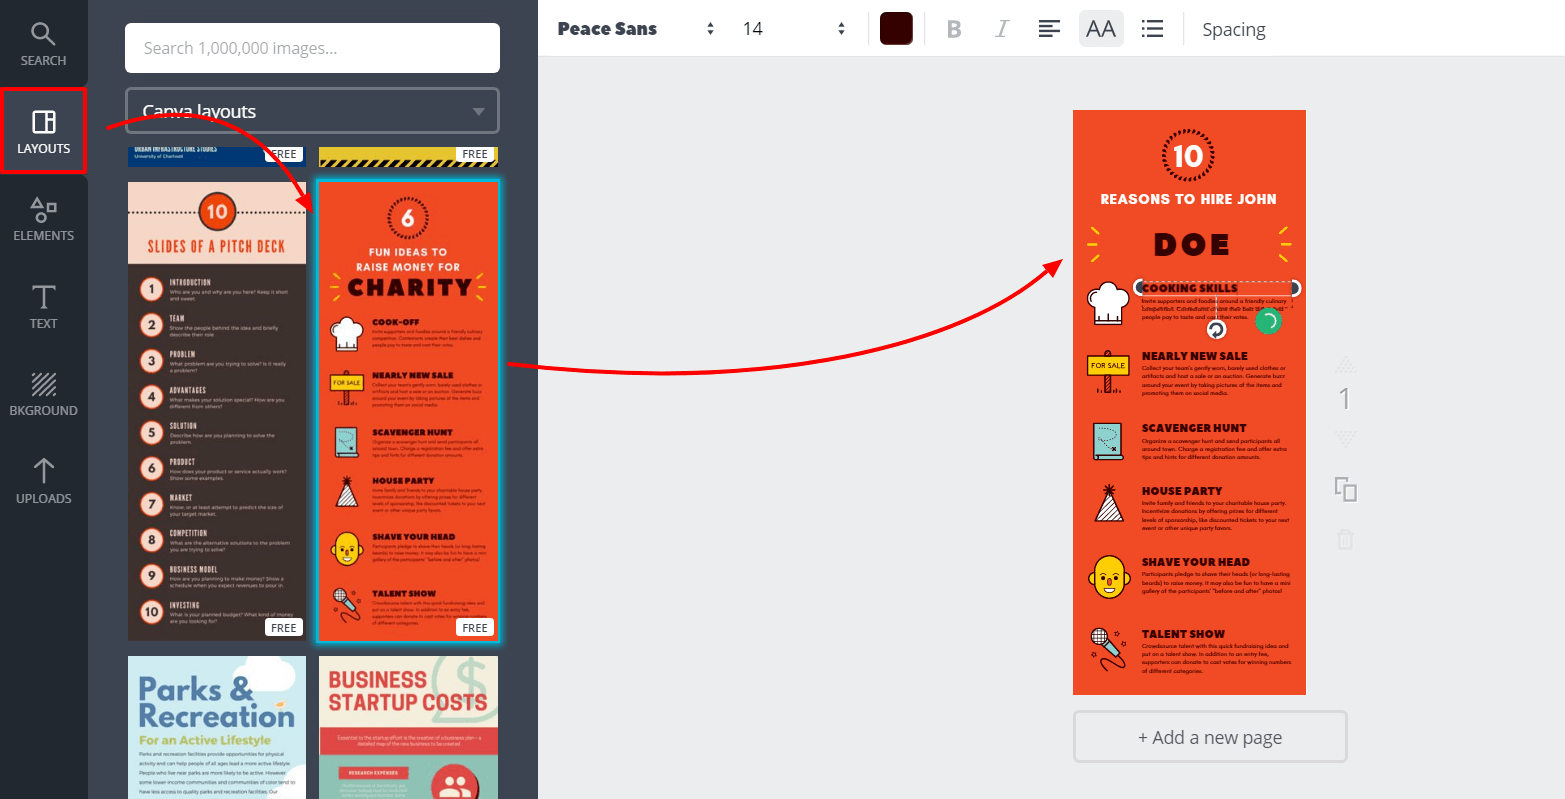
You can breeze through the design process by selecting a premade layout. Simply click on the Layouts tab from the left panel to start editing your infographic’s content.
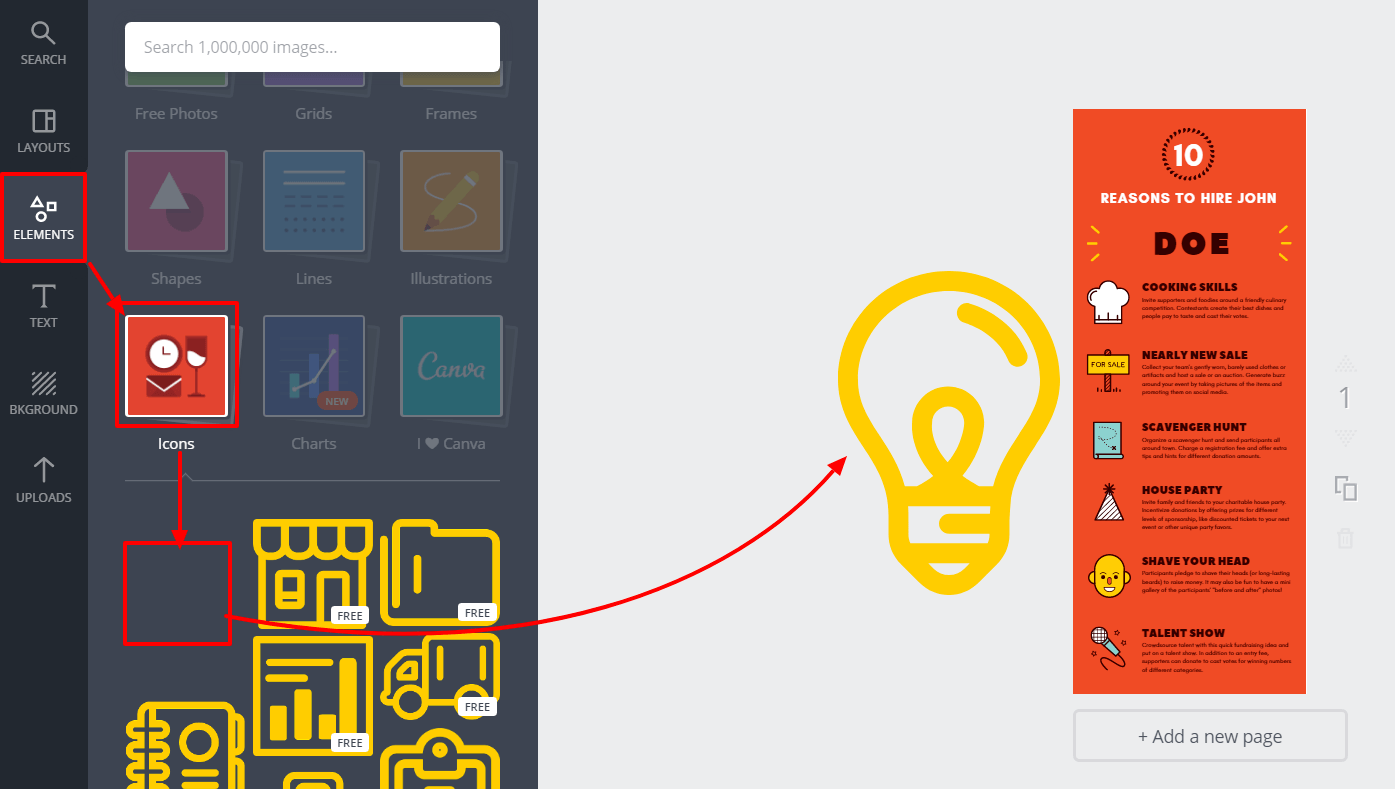
To customize your design, you can insert additional elements such as icons, grids, charts, and photos from the Elements tab. You can take advantage of the platform’s drag-and-drop interface to quickly add, edit, and adjust elements as you go.
You can also edit the finer details of your design such as text alignment, fonts, and spacing. For further personalization, you can upload your own background, photos, and other self-made assets. If you think Canva isn’t a great fit for your needs, you can also consider other alternatives like Visual.ly. These platforms have similar features, so it should be easy to pick them up in the soonest possible time.
4. Highlight Your References and Certifications
All employers need to answer one question before finalizing a new hire: are you trustworthy? Sure, you probably have a fancy resume and some artistic skills. But at the end of the day, resumes and interviews are only meant to boost your employer’s confidence in bringing you onboard. Fortunately, infographics make it easy to show off your certifications, accolades, and noteworthy achievements through logos. And as icing on the cake, try to include testimonials or commendations from previous employers, university professors, and other references. Of course, you just need to secure their permission to use their words, name, and basic information. Below is an example on how testimonials can fit into infographics:
Infographic source [8]
5. Do It the Easy Way
Creating an infographic resume DIY-style can be attainable, but it sure is time-consuming. If you want to avoid the hassle and complexity involved with creating infographic resumes, consider hiring a freelancer or professional infographic design agency [9]. Once you do get the job, then you should be free to experiment with your own design skills. Keep in mind that infographics are not only useful for resumes, they can also spice up your reporting, brand management, and social media skills. Here’s an infographic that fully explores all the possibilities:
Infographic source [10]
Final Words
Finally, remember that there are no rules when it comes to getting ahead. You need to leverage all the tools you can lay your hands on if you really want your personal brand to stand out. Visualize your resume, build an online portfolio, attend more seminars – the only limit is your own willingness to go the extra mile. Good luck on your next job interview!


